2024 Call Statistics
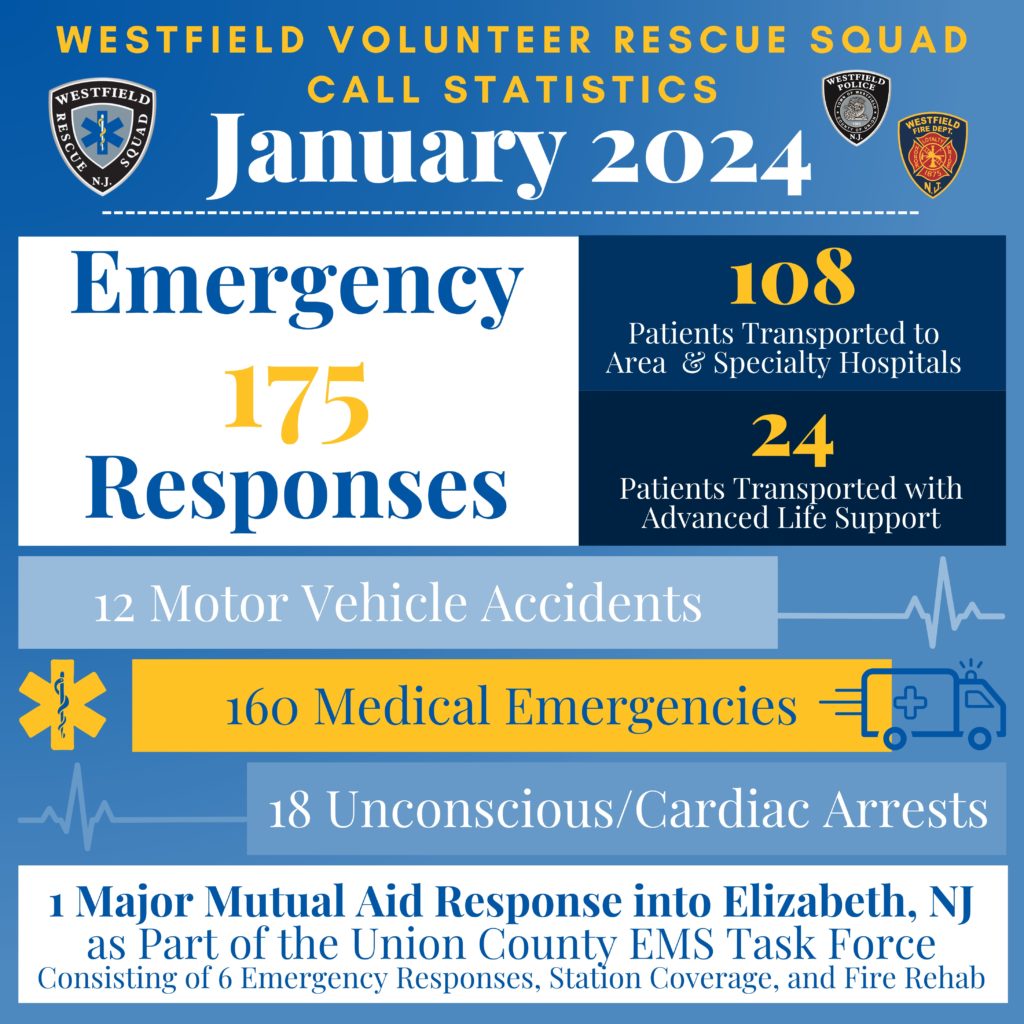
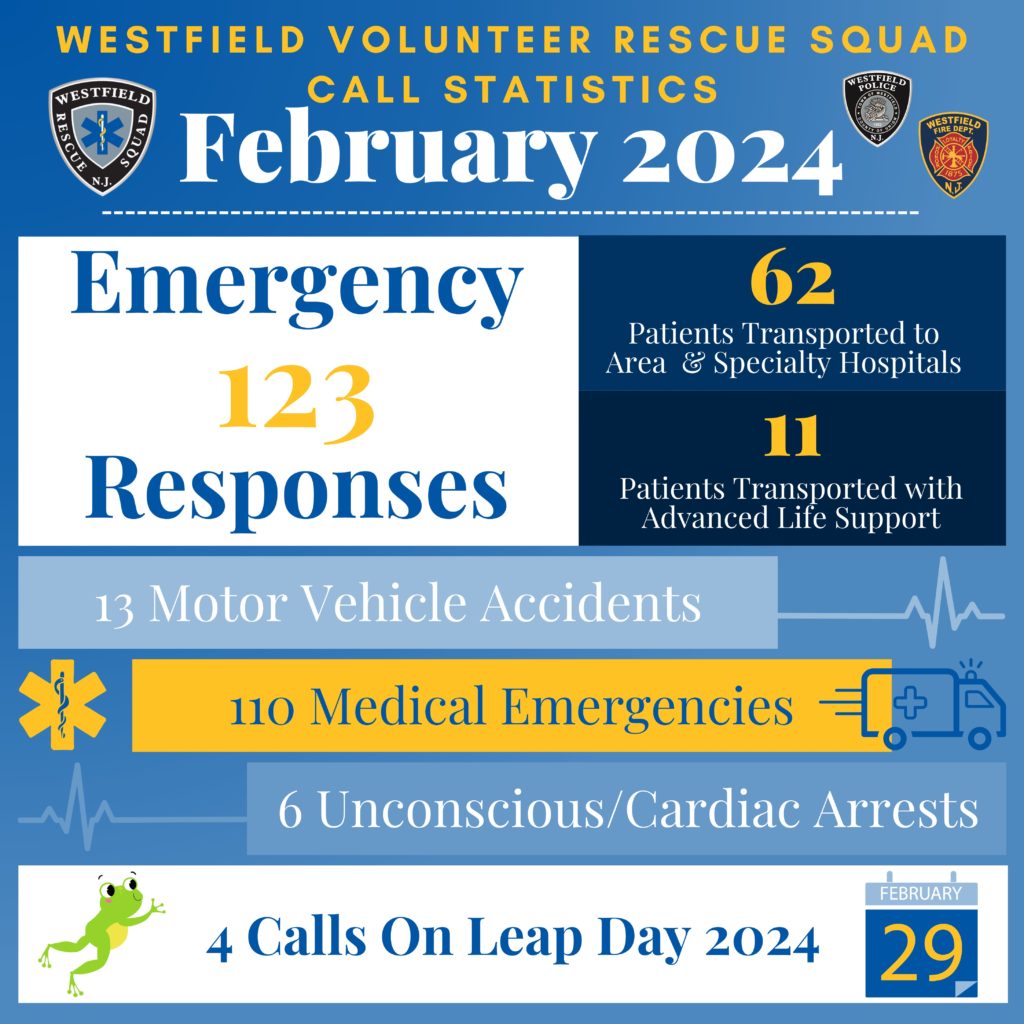
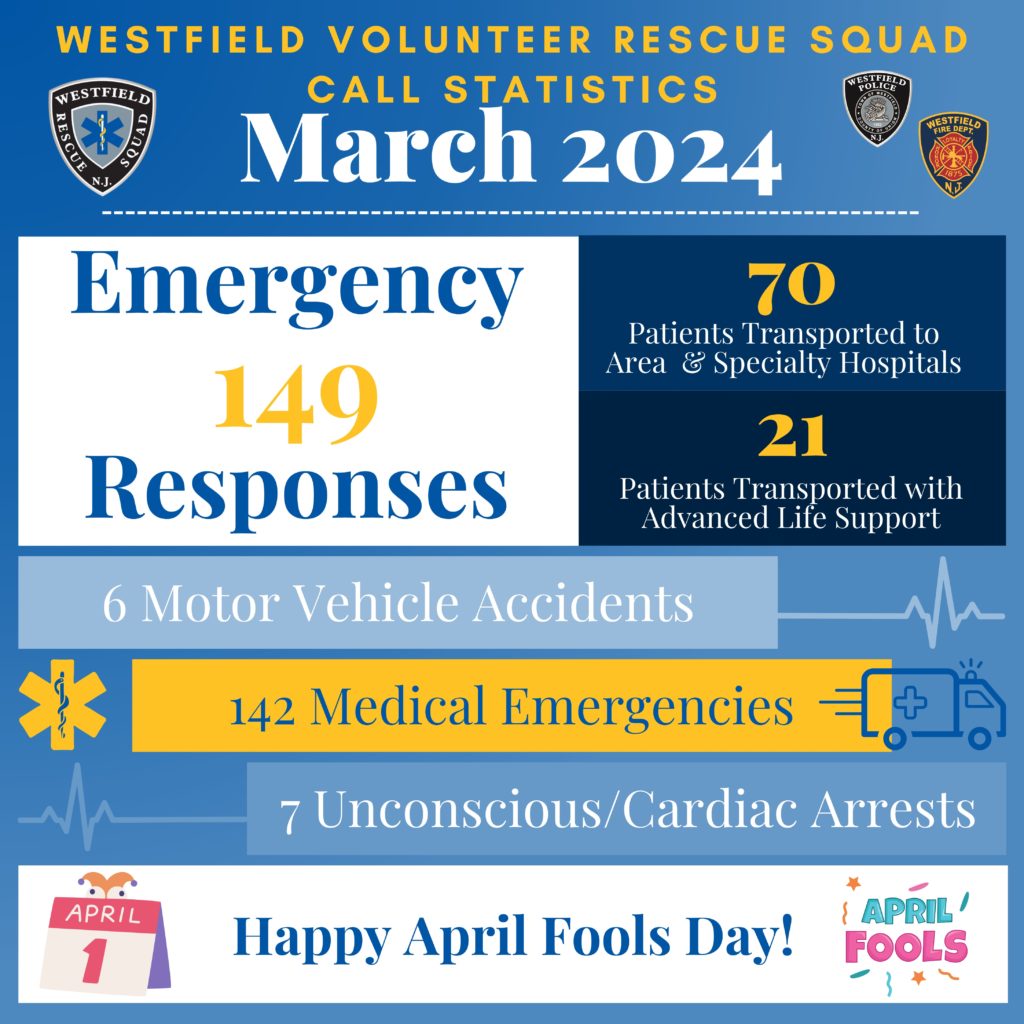
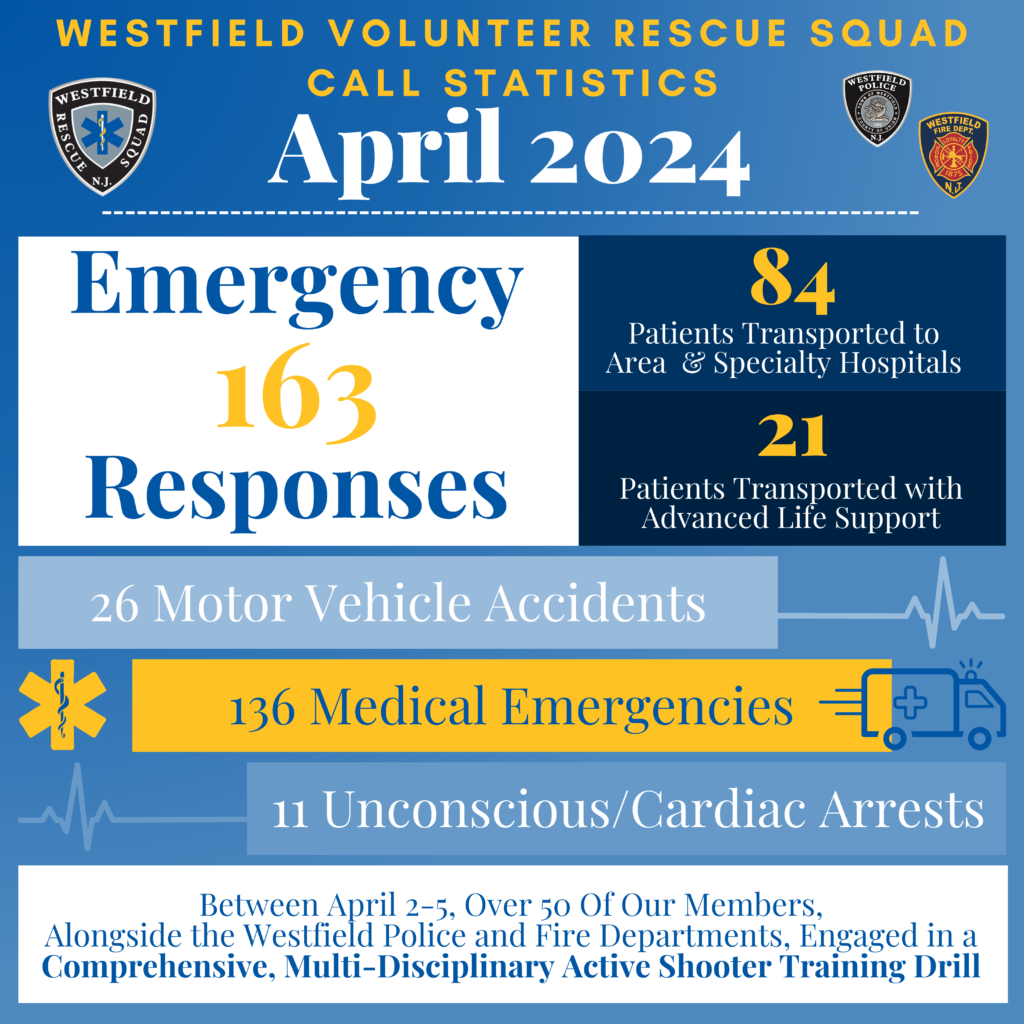


July 2024
August 2024
September 2024
October 2024
November 2024
December 2024
2023 Call Statistics
Total Calls: 1,502
Calls By Month
January: 108
May: 114
September: 139
February: 96
June: 131
October: 143
March: 114
July: 130
November: 137
April: 92
August: 149
December: 149
Rig Used
550: 765
551: 36
552: 701
Total Transports: 1, 011
Overlook: 683
RWJ New Brunswick: 3
RWJ Rahway: 182
University: 17
Trinitas: 33
Trinitas New Point: 25
Morristown: 35
Cooperman Barnabus: 18
JFK: 12
Overlook SED: 3
RMA/AMA/Canceled: 491
Nature of Calls
Abdominal Pain – 52
Heart Problems – 18
Allergic Reactions – 19
Hemorrhage/Laceration – 19
Animal Bite – 4
Ingestion/Poisoning – 2
Assault – 8
Medical Alarm – 4
Diabetic Emergency – 17
Special Event Stand By – 30
Flu-like Symptoms – 6
General Aches – 13
Back Pain – 22
Motor Vehicle Crash – 97
Breathing Problems – 163
Burns – 4
Opiate Overdose – 8
CO Poisoning/Hazmat – 1
Alcohol Related – 12
Eye Injury – 1
Stroke/CVA/TIA – 30
General Injury – 37
Traumatic Injury – 36
Unknown – 18
No Other Appropriate Choice – 5
Cardiac Arrest – 22
Unconscious/Fainting – 68
Pain – 34
Chest Pain – 59
Pregnancy/Childbirth – 2
Choking – 11
Psychiatric/Behavioral – 97
Convulsions/Seizures – 24
Sick Person – 283
Fall – 247
Traffic Accident – 13
Headache – 15
*Statistics sourced from multiple sources and may not match accordingly

